10 Feb. 2026 /Mpelembe Media — Google Cloud Observability is a deeply integrated fabric of managed services designed to maintain reliability at a planetary scale. It moves beyond simple monitoring by correlating metrics, logs, traces, and profiles to provide a holistic view of infrastructure and application health. The platform is increasingly shifting toward open standards (OpenTelemetry, Prometheus) and AI-assisted operations (Gemini) to reduce the complexity of managing distributed systems.
Core Pillars of Observability
Cloud Monitoring & Monarch: Built on Monarch, Google’s global in-memory time-series database, Cloud Monitoring ingests terabytes of data per second. It supports PromQL (Prometheus Query Language) as a first-class citizen for querying metrics, allowing users to leverage existing open-source skills and dashboards. It enables pro-active alerting on metrics, uptime checks, and Service Level Objectives (SLOs).
Cloud Logging & Log Analytics: A high-performance ingestion engine that uses a Log Router to direct data to storage buckets, BigQuery, or Pub/Sub. The new Log Analytics feature allows users to query logs using standard SQL, bridging the gap between operational logging and big data analysis.
Cloud Trace: A distributed tracing system that captures latency data across microservices. It visualizes request propagation via heatmaps and detailed span graphs, helping engineers identify bottlenecks in complex architectures.
Cloud Profiler: A continuous, low-overhead profiler (typically <0.5% CPU/RAM impact) that analyzes code execution in production. It identifies inefficient functions consuming excessive CPU or memory (heap) without impacting application performance.
Error Reporting: Acts as an intelligent aggregator that analyzes log streams to group similar stack traces and crashes. It filters out noise to notify developers only when new or resurfaced errors occur.
Modern Collection & Open Standards
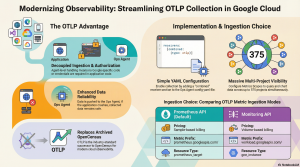
Ops Agent: The unified telemetry agent for Compute Engine that combines Fluent Bit (for logs) and the OpenTelemetry Collector (for metrics/traces) into a single binary. It supports high-throughput logging and third-party app integrations (e.g., Postgres, Nginx) via simple YAML configurations.
Managed Service for Prometheus: A fully managed solution that allows users to run Prometheus globally without managing infrastructure. It retains data for 24 months and enables global querying via PromQL, supporting both managed collectors and self-deployed agents.
OpenTelemetry (OTLP) Support: The platform natively supports the Telemetry API, which implements the OTLP protocol. This allows applications to push traces and metrics directly to Google Cloud using vendor-neutral SDKs, bypassing proprietary exporters.
AI-Driven Operations (AIOps)
Gemini Cloud Assist: Integrates generative AI to shift from “manual” to “assisted” observability. It offers features like Investigations to correlate disjointed signals (logs, errors, metrics) and pinpoint root causes. It also provides natural language interfaces for querying log data and optimizing cloud costs.
Data Governance & Scopes
Observability Scopes: To manage data across complex organizations, Google Cloud uses Metrics Scopes and Log Scopes. These constructs allow a single “scoping project” to view and analyze telemetry from hundreds of other projects, enabling centralized operations centers without moving the underlying data.
Instead of starting a support ticket from scratch, the tool performs a “warm handoff” by transferring the complete investigation context—including the AI’s analysis, reasoning, and correlated signals—directly to the support engineer. This process eliminates the need to repeat information, ensures efficient collaboration, and significantly reduces the time required to resolve critical issues.
The Google Cloud Telemetry (OTLP) API enables ingestion of traces and metrics using the OpenTelemetry protocol. It offers higher limits than proprietary APIs and ensures ecosystem compatibility. Data is viewable in Trace Explorer and Metrics Explorer via Cloud Monitoring.
Here are the key benefits of using the Telemetry OTLP API:
OpenTelemetry Compatibility: The API implements the OpenTelemetry OTLP protocol, meaning your data is stored in a format generally consistent with the protocol’s definitions. This allows you to use standard OpenTelemetry SDKs or Collectors without relying on a Google Cloud-specific exporter for your instrumentation.
More Generous Quotas: The usage limits for the Telemetry API are often more generous than those for the proprietary Cloud Trace API.
Access to Advanced Features: Certain Google Cloud features, such as Application Monitoring, rely on information that is only available when trace data is sent specifically through the Telemetry API.
VPC Service Controls Support: The Telemetry API is a supported service for VPC Service Controls. This allows you to create security restrictions specific to the telemetry.googleapis.com service without affecting other services (like cloudtrace.googleapis.com) that might also be ingesting trace data.
Note on Data Residency: If you require Assured Workloads due to data residency or Impact Level 4 (IL4) requirements, the sources explicitly state you should not use the Telemetry API for trace spans.
To migrate from the proprietary Cloud Trace API to the Telemetry OTLP API, you essentially need to change how your application exports data. Instead of using a Google Cloud-specific exporter, you should configure your application to export data using the OpenTelemetry Protocol (OTLP).
Based on the provided sources, here are the architectural options and requirements for this migration:
1. Choose an OTLP Export Method
Google recommends two primary ways to instrument your application to send trace data via the Telemetry API:
Use an OpenTelemetry Collector (Recommended): Configure your application to use an exporter that writes OTLP data to an OpenTelemetry Collector. The Collector then forwards this trace data to the Telemetry API.
Use a Direct In-Process Exporter: Use an in-process OTLP exporter supported by your language’s OpenTelemetry library to send telemetry directly to the Telemetry API. This method does not require a sidecar or separate collector instance.
2. Configure Authentication
Whichever method you choose, the exporter must be authorized to send data to your Google Cloud project. You can typically configure this using Google Cloud Application Default Credentials (ADC) by adding the language-specific Google Auth Library to your application.
Important Constraints
Assured Workloads: If your project uses Assured Workloads due to data-residency or Impact Level 4 (IL4) requirements, you should not use the Telemetry API. You must continue using the standard Cloud Trace API for trace spans.
Metric Handling: If you are also migrating metrics, be aware that the Telemetry API (telemetry.googleapis.com) handles metric naming differently than the googlemanagedprometheus exporter. For example, the Telemetry API allows periods and slashes in metric names, whereas the Prometheus exporter converts them to underscores. This can result in duplicate metrics if you mix ingestion paths.
Benefits of Migrating
By migrating to the Telemetry API, your data storage becomes generally consistent with the OpenTelemetry OTLP protocol, and your instrumentation is no longer locked into a Google Cloud-specific exporter. Additionally, the Telemetry API often offers more generous usage limits than the Cloud Trace API.
When OTLP metrics are sent to Google Cloud via the Telemetry API (either through an OpenTelemetry Collector or directly from an SDK), they are automatically mapped to Cloud Monitoring’s metric structures.
Here is a breakdown of how this mapping works based on the provided sources:
1. Monitored Resource Mapping
All OTLP metrics are mapped to the prometheus_target monitored resource type in Cloud Monitoring.
To populate the labels for this resource, the API maps specific OpenTelemetry attributes according to a priority list. If explicit values aren’t provided, fallback logic is used:
location (Required): Derived from location, cloud.availability_zone, or cloud.region attributes.
cluster: Derived from cluster, k8s.cluster.name, or inferred from the platform (e.g., __gce__ for Compute Engine).
namespace: Derived from namespace, k8s.namespace.name, or service.namespace.
job: Derived from job, service.name, faas.name, or Kubernetes workload names (e.g., k8s.deployment.name).
instance (Required): Derived from instance, service.instance.id, faas.instance, k8s.pod.name, or host.id. Note: If this value is empty, the metric point is rejected.
2. Metric Name and Structure
Metrics are converted into the Prometheus time-series format with the following structure: prometheus.googleapis.com/{metric_name}/{suffix}
Naming: The metric name generally retains its original name but is prefixed with prometheus.googleapis.com.
Suffixes: A suffix is added based on the OTLP point kind (e.g., /gauge, /counter, /histogram).
Target Info: A special target_info metric is created for each unique resource, containing all resource attributes except specific service identifiers.
Important Data Type Conversion: All OTLP INT64 metrics are converted to the DOUBLE value type in Cloud Monitoring. This prevents type collisions in the backend.
3. Metric Type Conversion Table
The Telemetry API maps OTLP metric types to Cloud Monitoring types as follows:
| OTLP Point Kind | Cloud Monitoring Kind | Suffix Added |
|---|---|---|
| Gauge | Gauge | /gauge |
| Sum (Monotonic, Cumulative) | Cumulative | /counter |
| Sum (Monotonic, Delta) | Delta | /delta |
| Sum (Non-monotonic) | Gauge | /gauge |
| Histogram | Distribution | /histogram (or /histogram:delta) |
| Summary | Split into multiple series | _sum, _count, and /summary (for quantiles) |
4. Differences from googlemanagedprometheus Exporter
If you are migrating or using mixed ingestion methods, be aware that the Telemetry API handles naming differently than the standard googlemanagedprometheus exporter:
Special Characters: The Telemetry API allows periods (.) and slashes (/) in metric names. The Prometheus exporter converts these to underscores (_).
Suffixes: The Telemetry API does not append units or _total suffixes to counters automatically, whereas the Prometheus exporter often does (e.g., foo vs. foo_seconds_total).
Using both ingestion paths simultaneously can result in duplicate metrics with slightly different names (e.g., foo.bar vs. foo_bar), so you may need to manually union them in queries.
Based on the sources, there are two primary API services for sending trace data to Google Cloud, each with specific export methods and use cases.
1. Telemetry (OTLP) API (Recommended)
Google recommends using the Telemetry API (telemetry.googleapis.com) for most use cases. This API implements the open-source OpenTelemetry OTLP protocol, allowing you to use standard OpenTelemetry SDKs without relying on a Google Cloud-specific exporter.
There are two ways to configure your application to send data to this API:
Via an OpenTelemetry Collector: You configure your application’s OTLP exporter to send data to an OpenTelemetry Collector (a sidecar or separate service). The Collector then forwards the trace data to the Telemetry API.
Direct In-Process Exporter: You use an in-process OTLP exporter provided by your language’s OpenTelemetry library to send telemetry directly to the Telemetry API. This method does not require running a separate Collector instance.
Benefits:
Generally supports more generous usage limits (quotas) than the Cloud Trace API.
Unlocks specific features like Application Monitoring.
Decouples your instrumentation from proprietary Google exporters.
2. Cloud Trace API (Proprietary)
The Cloud Trace API (cloudtrace.googleapis.com) is the proprietary Google Cloud API for trace data. While the Telemetry API is preferred for general use, the Cloud Trace API is required for specific compliance scenarios.
Data Residency & Assured Workloads: If your project uses Assured Workloads due to data-residency or Impact Level 4 (IL4) requirements, you must use the Cloud Trace API. The sources explicitly state you should not use the Telemetry API for trace spans in these environments.
Authentication
Regardless of the method chosen, your exporter must be authorized to send data to your Google Cloud project. This is typically handled by configuring Application Default Credentials (ADC) using a language-specific Google Auth Library.
The sources are exclusively focused on Google Cloud’s telemetry and observability ecosystem, defining telemetry in the context of cloud computing as the “instrumentation, collection, and analysis of technical data generated by the interaction between users, applications, and the underlying cloud infrastructure”.
The provided documents cover the following cloud-specific telemetry topics:
Data Types: Metrics (performance measurements), Logs (event records), Traces (request propagation), and Profiles (resource usage).
Collection Tools: The Ops Agent for VM telemetry, Managed Service for Prometheus for container metrics, and the OpenTelemetry (OTLP) API for traces and metrics.
Storage and Analysis: Systems like Monarch (in-memory time-series database), Cloud Logging buckets, and Cloud Trace storage.
AI Integration: Tools like Gemini Cloud Assist that use telemetry for troubleshooting cloud applications.