
Architecting the Agentic Economy: Inside the GROW ZAMBIA Sovereign Simulation Engine at growzambia.ai.studio
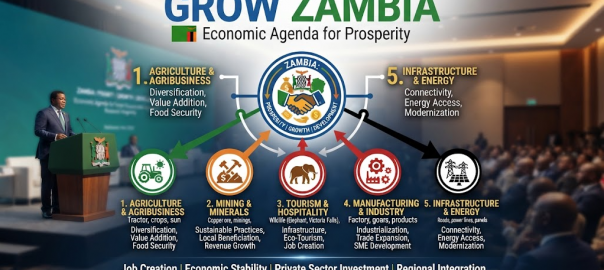
Wed, Nov 17 2026 /Mpelembe Media/ — The GROW ZAMBIA — Agentic Economic Simulation, accessible at growzambia.ai.studio, serves as a sovereign digital twin engineered to support the Zambian government’s strategic transition from post-default macroeconomic stabilization toward an expansionary operational model. Anchored in the Grow Zambia Agenda presented by President Hakainde Hichilema, the national strategy aims to more than double annual gross domestic product by 2031 through the 10-10-5-3-3-1-1-1 sectoral production targets across mining, energy, agriculture, tourism, and livestock. Rather than relying on traditional static input-output matrices or computable general equilibrium frameworks, the platform implements an Agentic Enterprise Architecture (AEA) that models macroeconomic dynamics from the bottom up to capture complex interdependencies across sectors.
The simulation engine organizes its operational mechanics into four interconnected architectural layers. At the top, the System of Engagement translates executive policy queries from institutions like the Cabinet Office, Presidential Delivery Unit, and decentralized Provincial Economies Labs into executable simulation parameters. Beneath it, the System of Agency orchestrates over 100 heterogeneous autonomous agent archetypes—ranging from smallholder farmers and informal vendors to mining houses and commercial banks—each operating with bounded rationality, localized objective functions, and adaptive memory. Analytical execution occurs within the System of Work, which integrates system dynamics differential equation solvers, causal inference engines, and the national MicroZAMOD tax-benefit microsimulation engine. Finally, the System of Context continuously anchors agent behaviors to ground-truth reality by ingesting live empirical data feeds—including Bank of Zambia exchange rates, ZamStats indicators, satellite agricultural metrics, and London Metal Exchange prices—into a unified semantic knowledge graph.
Operating as a Level 6 Sim-to-Real Economic Twin on the Economic World Model spectrum, the platform leverages a two-stage Agentic Economic Modeling (AEM) pipeline that generates synthetic agent decisions and applies a bias-correction mapping calibrated against empirical survey microdata. Using structural causal inference and counterfactual experiments, the simulation stress-tests critical systemic bottlenecks before public funds are committed. For instance, it models the energy constraint dictating that achieving 3.0 million tonnes of annual copper output requires over 8,000 MW of dedicated baseload electricity, revealing that production caps near 1.25 million tonnes without power expansion. Similarly, it simulates how transitioning agricultural support from inorganic fertilizer subsidies toward soil organic matter conservation stabilizes crop yields, while using MicroZAMOD to forecast the poverty and inequality impacts of programs such as Cash for Work and fuel subsidy reforms under strict machine-readable fiscal guardrails.
From “Homo Silicus” to Sovereign Digital Twins: 5 Mind-Bending Takeaways on How AI Agents Are Rewriting Economic Reality
1. Introduction: The Death of Guesswork in Public Policy and Business
For decades, economic decision-making at the institutional level has resembled flying blind through a thunderstorm. When a multinational corporation restructures its global pricing or a national government reforms fuel subsidies, they are effectively executing uncalibrated, live-market experiments. Millions of dollars in corporate capital or fragile public stability are put on the line, with feedback arriving months or years later via delayed statistical surveys and trial-and-error field tests. If a policy fails or a price elasticity assumption proves wildly inaccurate, the damage—market share erosion, fiscal deficits, or social unrest—is already done.
The emergence of Agentic Economic Modeling (AEM) and multi-agent Economic World Models (EWMs) shatters this reactive paradigm. Foundation models are no longer merely drafting reports or answering customer support queries. Under the emerging “homo silicus” framework, Large Language Models (LLMs) operate as synthetic economic agents capable of context-sensitive reasoning, memory, and bounded strategic planning within dynamic digital twin environments.
By populating calibrated digital sandboxes with thousands of heterogeneous AI personas, corporate strategists and sovereign policymakers can now stress-test complex counterfactual scenarios—evaluating consumer demand shifts, supply chain shocks, and fiscal redistribution schemes—in a zero-risk environment before committing a single dollar or enacting a binding decree. From executive boardrooms to national ministries of finance, agentic simulation is transforming economic forecasting from speculative guesswork into an empirical, high-fidelity engineering discipline.
2. Takeaway 1: Raw AI Agents Make Terrible Economic Decision-Makers—Unless You Use the “10% Calibration Rule”
Deploying off-the-shelf LLMs directly as synthetic survey respondents or market proxies is a recipe for catastrophic decision-making. Recent breakthroughs in Agentic Economic Modeling demonstrate that raw, uncorrected LLM outputs suffer from severe machine bias, unnaturally low within-topic variance, and distorted demand elasticity estimates. When uncalibrated models are asked to predict human economic choices, their internal preference biases cause naive econometric estimates to fail, often generating higher error rates than basic baseline averages.
To understand why raw LLMs fail—and how to fix them—economists look to Daniel McFadden’s foundational Random Coefficient Discrete Choice Model (DC-RUM). In economic theory, aggregate market decisions are rarely driven by a single representative agent; rather, they represent a mixture of choices across diverse individuals with varied preference weights:
$$\text{Pr}(\text{community chooses } j) = \sum_{i \in I} \theta_i \frac{\exp(w_i^\top X_j)}{\sum_k \exp(w_i^\top X_k)}$$
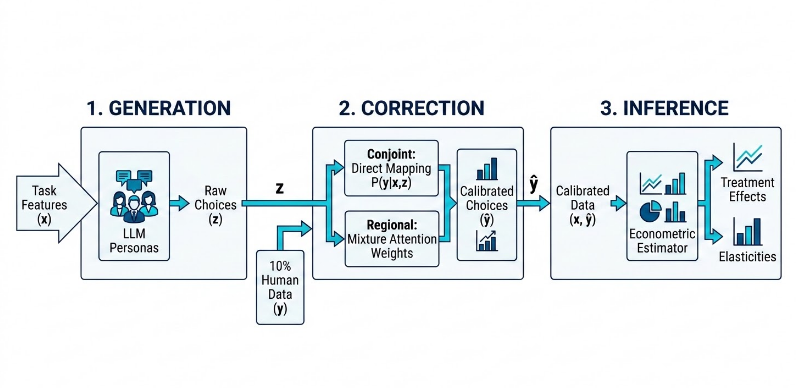
Where $w_i$ represents the decision parameters of persona $i$ , and $\theta_i$ represents the population weight assigned to that decision rule. Rather than forcing a single LLM prompt to mimic an entire demographic, the Generation–Correction–Inference framework operationalizes McFadden’s insight through a three-stage statistical pipeline:
- Generation: Multi-agent LLM systems generate task-conditioned synthetic choices ( $z$ ) across thousands of distinct AI personas, capturing broad cognitive variations and decision heuristics.
- Correction: A statistical bias-correction model ( $f$ ) is trained on a minimal sample of ground-truth human data ( $y$ )—typically just 10% of the target population or geographic regions ( $Z_{\text{ID}}$ ). The mathematical mechanism differs by observability:
- Individual Granularity (Conjoint Tasks): The corrector learns a direct conditional probability mapping $P(y \mid x, z)$ from task features $x$ and raw LLM choices $z$ to estimate calibrated human choice probabilities $\hat{y}$ .
- Aggregate Granularity (Regional Markets): Where individual choices are hidden, a Mixture-of-Personas attention mechanism learns weighting parameters $\theta_i$ across order-persona triplets $t_i = (o_i, p_i, c_i^l)$ using an attention architecture: $$\theta_i = \frac{\exp(U^\top \tanh(V h_i))}{\sum_{k=1}^N \exp(U^\top \tanh(V h_k))}$$
- Inference: Standard econometric estimators (such as Difference-in-Differences or Multinomial Logit models) perform inference on the corrected datasets $(x, \hat{y})$ to derive true demand elasticities and counterfactual treatment effects.
The power of this “10% Calibration Rule” was empirically proven in a large-scale nationwide regional field experiment evaluating online retail delivery options across 906 geographic regions (ZIP3s). While raw LLM outputs misestimated consumer behavior by over 300 basis points, the Mixture-of-Personas correction model—trained on only 10% in-domain regions ( $Z_{\text{ID}}$ )—predicted treatment effects on hold-out regions ( $Z_{\text{OOD}}$ ) at -65 ± 10 basis points (bps) , precisely matching the full national human field experiment result of -60 ± 8 bps .
“Relying directly on LLM choices for demand estimation is suboptimal… Rather than trying to make individual LLMs perfectly mimic human behavior, we generate diverse synthetic agents through different personas, and learn the optimal weights to match observed choice patterns.”
3. Takeaway 2: “Your Business Architecture IS the Prompt”
As autonomous agents evolve from isolated co-pilots into enterprise orchestration systems, the paradigm governing software engineering is undergoing a seismic transition: from Automation to Autonomisation .
- Automation asks: “How do we execute this explicit process efficiently?” It relies on rigid, hard-coded logic trees, pre-defined state flows, and deterministic API integrations.
- Autonomisation asks: “What is the goal, and what is the agent allowed to do to achieve it?” It centers on natural language goal specification, dynamic reasoning, autonomous tool selection, and machine-enforceable guardrails.
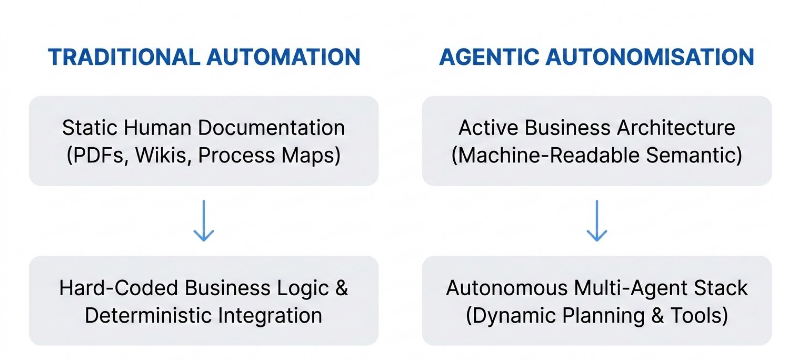
In an autonomised enterprise, static corporate documentation—process models, capability maps, compliance manuals, and operating rules—is transformed into active semantic metadata. Modern frameworks, such as the PwC Agentic Enterprise Architecture (AEA) model, collapse traditional IT structures.
Historically, Enterprise Architecture was segmented across five separate domains: Business, Application, Data, Technology, and Common . In an agentic environment, the separate Technology domain is absorbed directly into cloud platform choices, serverless configurations, and zero-trust security policies. This simplifies enterprise architecture into four streamlined, operational domains:
- Common Domain: Establishes overarching organizational context, strategy, and taxonomy.
- Business Domain: Functions as the primary prompt engine. Capability maps define functional contracts, process models supply execution instructions, and operating policies set machine-readable guardrails.
- Agents & Apps Domain: Represents the functional convergence of software applications and autonomous agents. Traditional software applications (UI, database logic, APIs) are merging with autonomous agents capable of calling APIs, orchestrating multi-step workflows, and generating custom execution code on the fly.
- Data & Knowledge Domain: Transforms data management into active knowledge curation. Unstructured corporate assets, communication threads, and regulatory documents are curated using Knowledge Graphs (GraphRAG), vector databases, and stateful memory stores to anchor agent reasoning in verified institutional truth.
“In an agentic enterprise, agents consume these artefacts to decide what to do. A capability definition becomes a contract. A process model becomes an execution instruction. A business rule becomes a guardrail.”
4. Takeaway 3: Simulating an Entire Nation: Inside Zambia’s “Level 6” Sovereign Digital Twin
Sovereign statecraft is deploying agentic simulation to navigate complex macroeconomic constraints. Following the resolution of its 2020 Eurobond default, the execution of a landmark US $1.36 billion Eurobond buyback, and the agreement of a US $1.472 billion International Monetary Fund (IMF) Extended Credit Facility, the Republic of Zambia launched the GROW ZAMBIA Agenda under President Hakainde Hichilema. The growth strategy aims to double national nominal output by 2031—generating an additional US $65 billion in annual GDP—while strictly adhering to an IMF benchmark requiring a 3.0% primary budget surplus by 2029.
To evaluate cross-sectoral economic policy trade-offs under tight fiscal constraints, the Zambian government deployed growzambia.ai.studio—a sovereign digital twin operating on an Agentic Enterprise Architecture. The national production agenda is explicitly encoded into an eight-part vector shorthand known as the 10-10-5-3-3-1-1-1 target vector:
$$\mathbf{V}_{\text{GrowZambia}} = \begin{bmatrix} \text{Maize (M tonnes)} \\ \text{Power (GW)} \\ \text{Tourists (M arrivals)} \\ \text{Copper (M tonnes)} \\ \text{Soya (M tonnes)} \\ \text{Wheat (M tonnes)} \\ \text{Sugar (M tonnes)} \\ \text{Beef Exports (\$B)} \end{bmatrix} = \begin{bmatrix} 10.0 \\ 10.0 \\ 5.0 \\ 3.0 \\ 3.0 \\ 1.0 \\ 1.0 \\ 1.0 \end{bmatrix}$$
Target Vector Code / Metric,Baseline Volume (2025/2026),Target Volume (2031),Required Scale / Growth Metric,Primary Structural Bottleneck
10.0M Tonnes Maize,4.94 Million Tonnes,10.0 Million Tonnes,2.02x Expansion,Rain dependence & Soil Organic Matter (SOM) depletion
“10,000 MW Power Capacity”,”3,986 Megawatts”,”10,000 Megawatts”,2.51x Expansion,Hydro-concentration & grid transmission capital
5.0M Tourist Arrivals,2.30 Million Arrivals,5.0 Million Arrivals,2.17x Expansion,Aviation capacity & regional lodge infrastructure
3.0M Tonnes Copper,”890,346 Tonnes”,3.0 Million Tonnes,~22.0% Compound Annual Growth Rate,”Baseload electric grid deficit (~8,000 MW required)”
3.0M Tonnes Soya Bean,”~400,000 Tonnes”,3.0 Million Tonnes,~7.50x Expansion,Irrigated land access & regional market logistics
1.0M Tonnes Wheat,”~300,000 Tonnes”,1.0 Million Tonnes,~3.33x Expansion,Commercial power tariffs for irrigation pumps
1.0M Tonnes Sugar,”~450,000 Tonnes”,1.0 Million Tonnes,~2.22x Expansion,Outgrower financing & industrial processing capacity
$1.0B Beef Export Revenue,< US $50 Million,US $1.0 Billion,20.0x Expansion,Sanitary and Phytosanitary (SPS) compliance
The enterprise architecture driving growzambia.ai.studio implements the exact four-layer Agentic Enterprise Architecture (AEA) framework used in forward-thinking corporate environments:
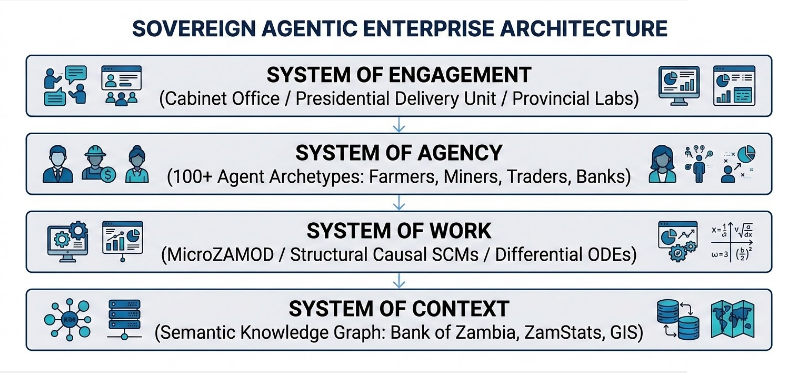
- System of Engagement: Interactive policy interfaces allowing leadership bodies (Cabinet Office, Presidential Delivery Unit, and Provincial Economies Labs across all ten provinces) to run counterfactual queries without editing base code.
- System of Agency: A multi-agent ecosystem containing over 100 heterogeneous agent archetypes (smallholder farmers, commercial mine operators, informal market vendors, commercial banks) operating with local adaptive memory and bounded rationality.
- System of Work: Execution engines combining the national MicroZAMOD tax-benefit microsimulation framework, differential equation solvers, and Structural Causal Models (SCMs) mapped as Directed Acyclic Graphs (DAGs). Policy interventions are isolated using Judea Pearl’s $do(\cdot)$ calculus: $$P(Y \mid do(Z = z_{\text{reformed}})) = \sum_{x} P(Y \mid Z = z_{\text{reformed}}, x) P(x)$$
- System of Context: A live semantic Knowledge Graph ingesting macroeconomic telemetry—Bank of Zambia exchange rate feeds, ZamStats inflation metrics, satellite crop health data, and global metal spot prices—grounding agent states in physical reality.
A striking counter-intuitive insight uncovered by growzambia.ai.studio involved the ecological dynamics of national agriculture. The engine integrated system dynamics differential equations modeling interactions between chemical Fertilizer Subsidy Programs (FSPs), Soil Organic Matter (SOM), and crop yields:
$$\frac{d(\text{SOM})}{dt} = \alpha \cdot (\text{Sustainable Practice Adoption}) – \beta \cdot (\text{Chemical Input Intensity}) – \gamma \cdot (\text{Erosion})$$
$$\text{Yield}_t = \Phi\left(\text{FSP}_t, \text{SOM}_t, \text{Rainfall}_t\right)$$
The simulation proved that relying exclusively on inorganic chemical fertilizer subsidies generates diminishing returns over time. High chemical input intensity without organic soil management depletes SOM, degrading soil structure and sharpening crop collapse during severe droughts. Reallocating state funds away from pure chemical subsidies toward soil-building practices (such as cover cropping and minimum tillage) preserves SOM, improves long-term drought resilience, and protects rural food security without expanding state spending.
5. Takeaway 4: The Shock-Responsive Social Protection Surprise: Cash for Work vs. Price Subsidies
During the severe 2023/2024 Southern African drought—which affected 84 of Zambia’s 116 districts, destroyed over 1 million hectares of maize, and impacted 9.8 million citizens—policymakers faced a severe crisis. To evaluate emergency interventions, government analysts paired the top-down macro digital twin (growzambia.ai.studio) with bottom-up micro-distributional tax-benefit tools: the MicroZAMOD microsimulation model (developed by ZIPAR, UNU-WIDER, and SASPRI using Living Conditions Monitoring Survey microdata covering 8,512 households and 43,786 individuals).
The analysis evaluated the full-year implementation of Phase 1 of the national Cash for Work (CFW) drought response programme. The microsimulation revealed specific distribution and poverty impacts:
- Fiscal Allocation: Direct spending totaled ZMW 1.9 Billion (excluding administrative overhead), aligning with the government’s ZMW 2.0 Billion supplementary budget allocation.
- Poverty Reduction: CFW reduced the national extreme poverty headcount by 0.6 percentage points (falling from a 48.8% baseline to 48.2%), lifting approximately 32,300 individuals out of extreme poverty.
- Inequality Mitigation: Income inequality measured by the Gini coefficient fell by 0.2 percentage points (dropping from 50.8 to 50.6).
- Targeted Distributional Gains: Reductions in extreme poverty were concentrated among the most vulnerable demographic categories:
- Single-parent households: Reduced extreme poverty by 1.7 percentage points (51.6% down to 49.9%).
- Elderly-headed households: Reduced extreme poverty by 1.8 percentage points (58.1% down to 56.3%).
- Households with no labor income: Reduced extreme poverty by 0.9 percentage points (52.1% down to 51.2%).
| Household Demographic Category | Extreme Poverty Δ |
|---|---|
| Overall National Population | -0.6 pp |
| Single-Parent Households | -1.7 pp |
| Elderly-Headed Households | -1.8 pp |
| Households with No Labor Market Income | -0.9 pp |
When contrasted with universal price subsidies—such as broad fuel subsidies, which historically cost up to 2.4% of GDP—microsimulations demonstrate that un-targeted price controls are highly regressive. Universal fuel subsidies disproportionately benefit high-income households while delivering negligible poverty reduction. Direct, targeted transfers like Cash for Work provide a far more progressive, shock-responsive, and fiscally sustainable tool for protecting vulnerable populations under strict sovereign budget constraints.
6. Takeaway 5: The 6-Level Capability Ladder: From Simple Chatbots to Real-World Economic Twins
To evaluate technical maturity across economic simulation engines, the Economic World Model (EWM) framework establishes a 6-Level Capability Ladder :
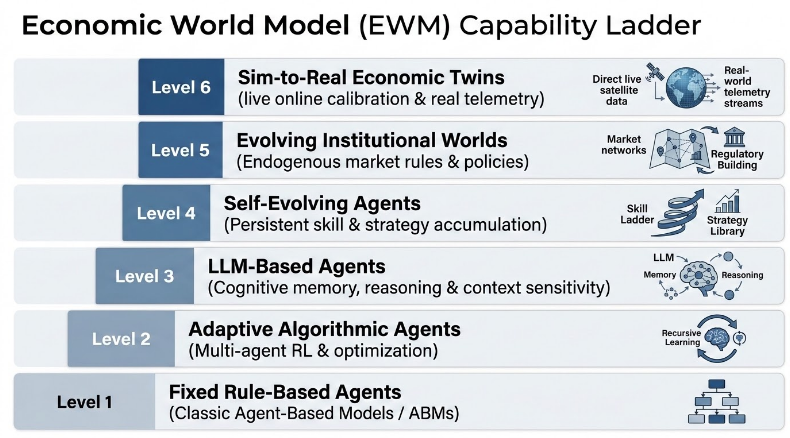
- Level 1: Fixed Rule-Based Agents: Classic Agent-Based Models (ABMs) operating on static, hard-coded decision scripts.
- Level 2: Adaptive Algorithmic Agents: Agents equipped with algorithmic optimization or multi-agent reinforcement learning (MARL), adapting choices within static market environments.
- Level 3: LLM-Based Agents: Cognitive agents leveraging foundation models for context-sensitive reasoning, textual evaluation, and dynamic memory processing (where most current research sits).
- Level 4: Self-Evolving Agents: Autonomous entities that persistently expand their strategy libraries and skill sets through experience over time.
- Level 5: Evolving Institutional Worlds: Environments where market mechanisms, regulatory structures, and policy rules adapt endogenously in response to emergent agent behaviors.
- Level 6: Sim-to-Real Economic Twins: High-fidelity simulation environments maintaining continuous online alignment loops with live macroeconomic telemetry, applying parameter updates whenever physical reality deviates from simulated trajectories.
Achieving Level 6 requires solving the fundamental problem of reflexivity . Unlike physical world models governed by invariant natural laws (such as thermodynamics or gravity), economic systems are endogenous. System state transitions depend on the subjective beliefs, expectations, and choices of participants. The aggregate economic state vector $s_t$ is defined as:
$$s_t = \left( x_t, \{z_{i,t}\}, \{b_{i,t}\}, I_t \right)$$
Where $x_t$ represents aggregate economic variables, $z_{i,t}$ represents objective private agent states, $b_{i,t}$ represents subjective belief states and forecasts, and $I_t$ represents the institutional framework. Because subjective agent forecasts ( $b_{i,t}$ ) directly drive aggregate state transitions ( $s_t \to s_{t+1}$ ), a Level 6 digital twin cannot function without the continuous online calibration loops established in the 10% Calibration Rule (Takeaway 1). Without real-time recalibration against live observations, reflexive feedback loops cause un-grounded simulations to drift rapidly from physical reality.
7. Conclusion: The Future of Decision-Making
The shift from static data dashboards to multi-agent economic simulation marks a fundamental turning point in organizational strategy and public governance. Retrospective reporting, intuition-driven leadership, and uncalibrated policy rollouts are being replaced by dynamic, bias-corrected digital twin architectures.
As economic world models mature, sustainable advantages will accrue to institutions—whether private enterprises or sovereign states—that construct calibrated, well-governed agentic architectures. Bridging enterprise software management with macroeconomic strategy requires robust semantic prompts, continuous empirical calibration loops, and machine-enforceable guardrails.
Is your organization’s enterprise architecture structured to govern, direct, and execute alongside an autonomous agentic workforce?